NUCLI AWR Data Visualization
Barcelona (Spain)
New NUCLI AWR Data Visualization
NUCLI presents the new version of AWR Data Visualization (named Analytics too) with many new features in terms of functionality and user interface, especially in the best user experience as well as improved access to AWR data from the tool allowing minimization the diagnosis time.
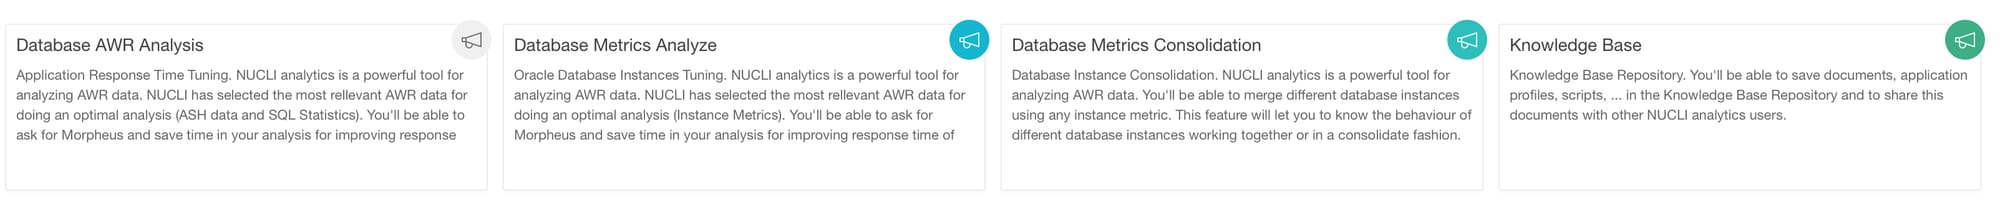
The next figure shows some features offered in the new version:
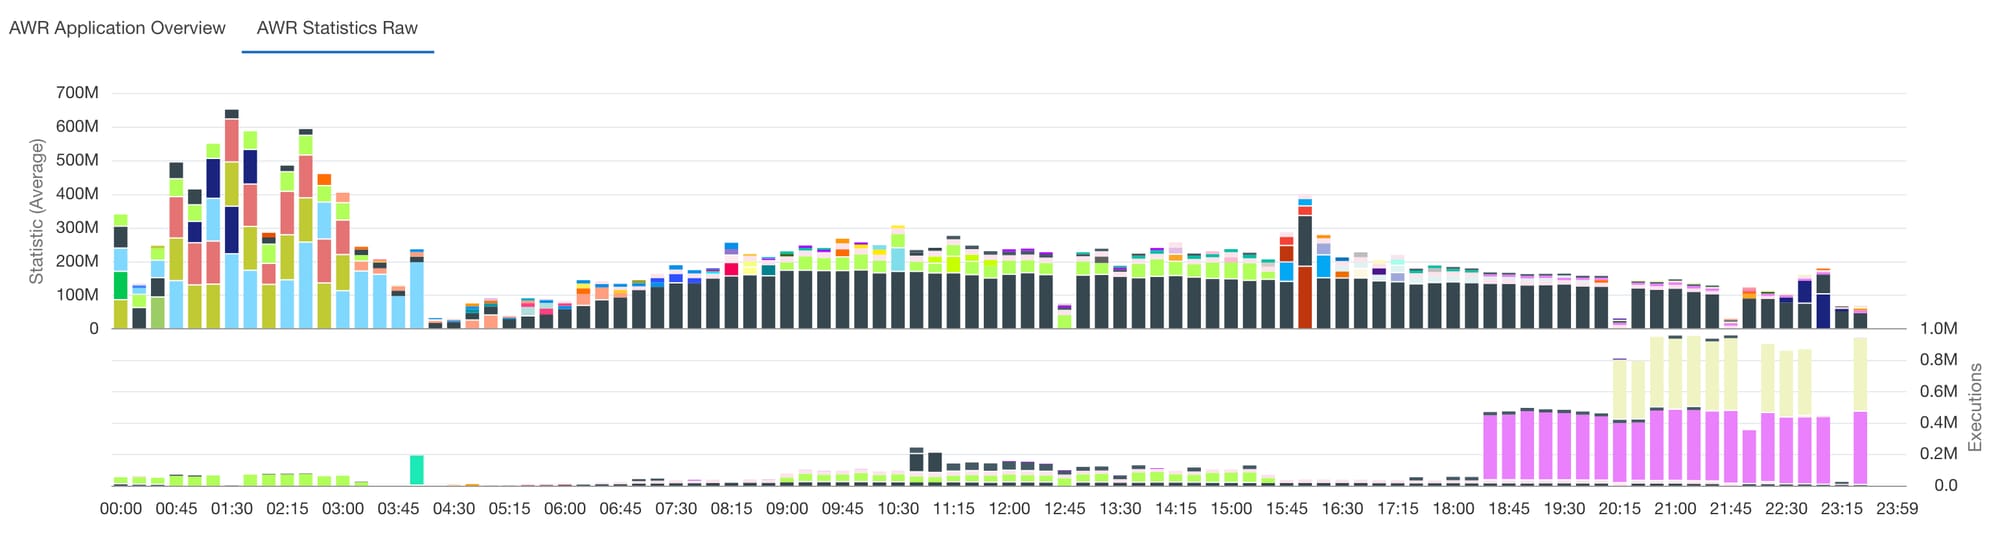
The new version also allows consolidating performance metrics of different databases in order to visualize the consolidated behavior and use map of an infrastructure where different Oracle database instances are executed:
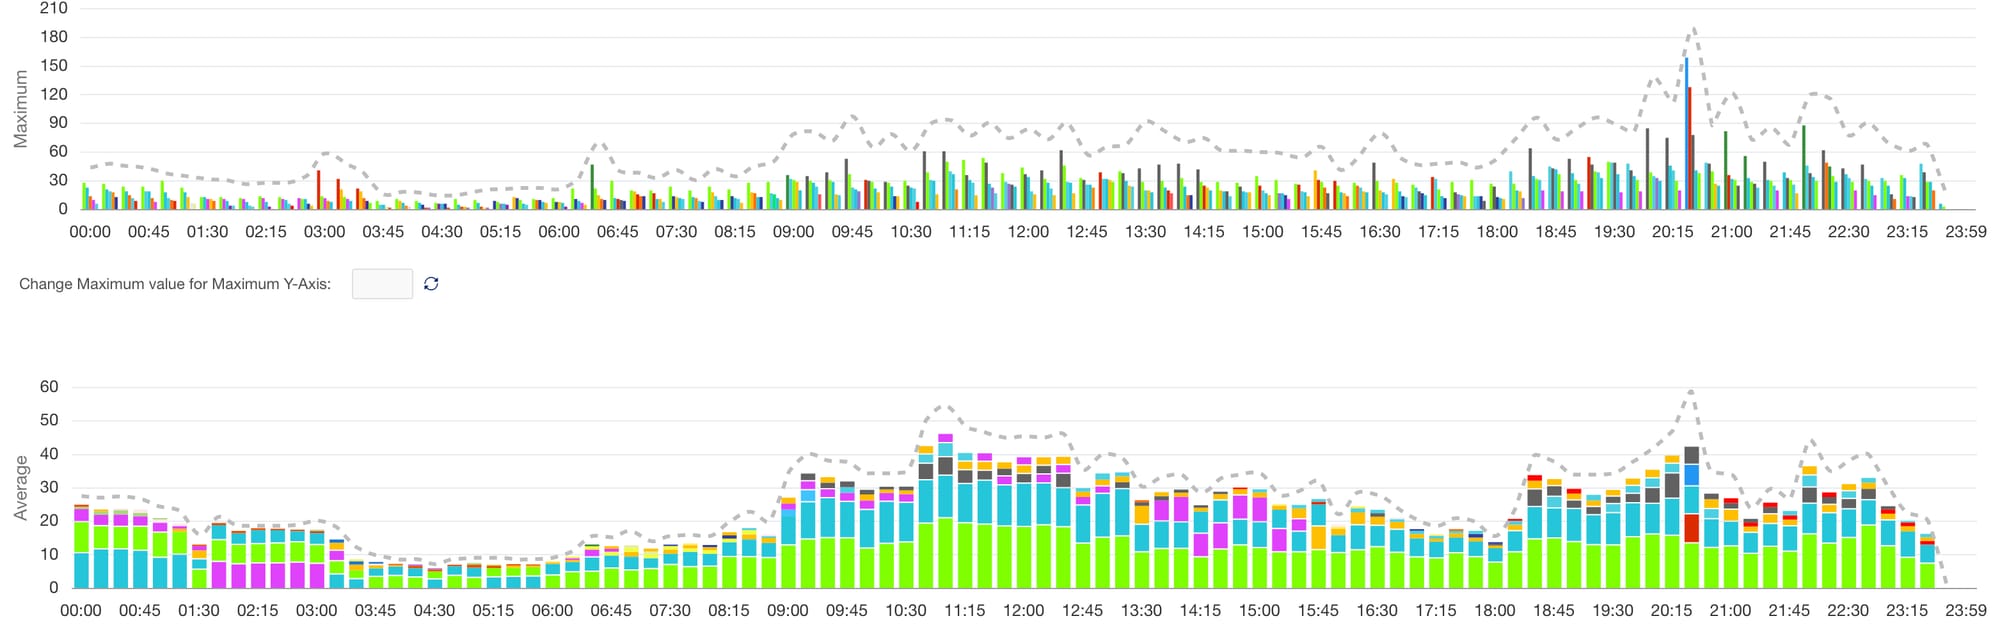
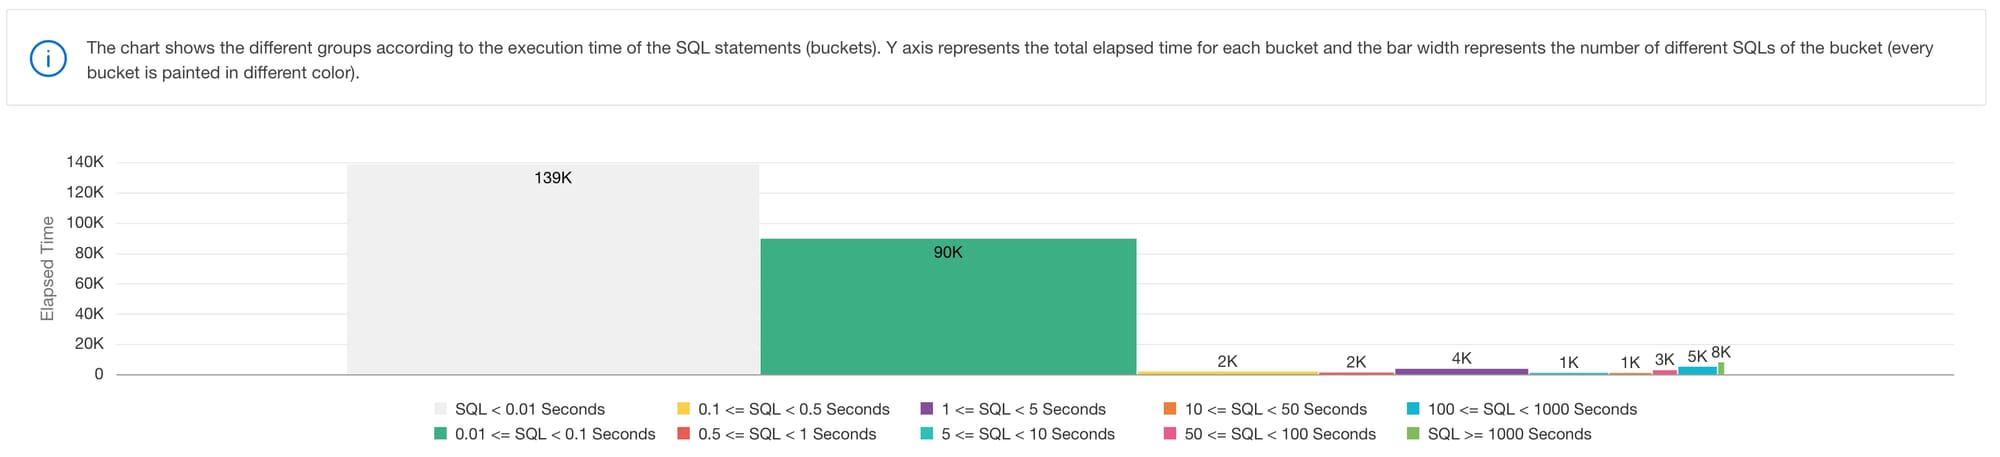
Another feature of this new version is that it offers intelligent graphics that allow the rapid localization of performance improvement points, significantly improving diagnosis and, in turn, not requiring expert diagnostic skills:

The new version benefits from the accumulated experience of more than 500 tunings of instances of Oracle databases and more specifically of tunings in the access to the data that the applications necessarily use.
NUCLI AWR Data Visualization also has a chatbot that offers help in diagnosing problems called Morpheus. The new version is available for any type of device and is already in production. For more information about the new version and how to use it, feel free to contact us and without any commitment, make a demonstration with performance data of any of your Oracle databases.